PostgreSQL Optimization & Scaling for High-Concurrency Platforms
When your database locks up, queries take seconds to execute, and connection pools exhaust during peak hours, we step in to diagnose root causes and tune your PostgreSQL architecture for sub-millisecond query execution.
Average Query Latency Drop
Drop in p95 and p99 query execution times
Cache Hit Ratio
Optimized shared buffers and Redis cache layers
Concurrent Connections
Supported via transaction-level connection pooling
Zero-Downtime Indexing
All schema optimizations applied concurrently
System Blueprint & Interface
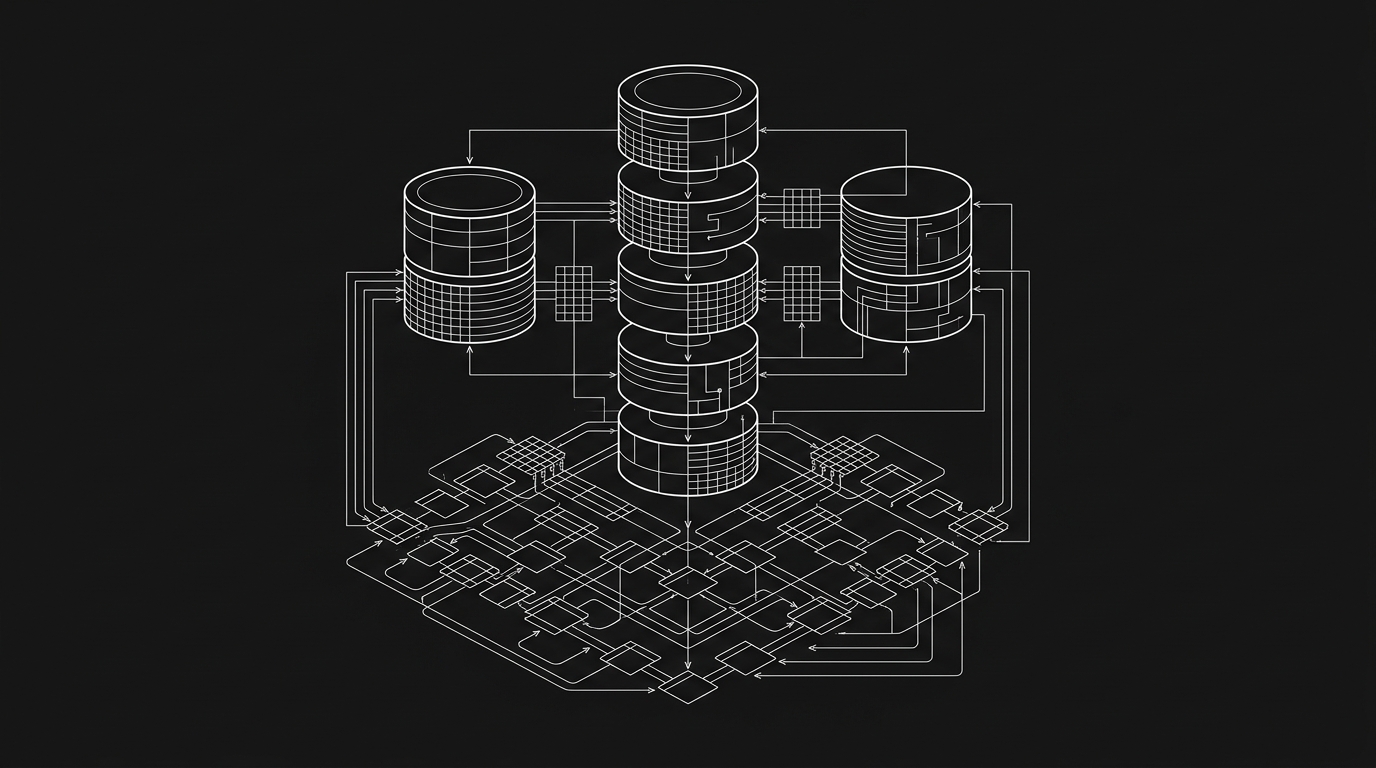
PostgreSQL Data Topology, Connection Pooling & Sharding Blueprint
The Ticking Time Bombs Inside Scaling Databases
Databases do not fail gradually—they operate fine until a tipping point in traffic triggers lock cascades and total system outages.
Slow, Locking Queries Freezing the App
Unindexed foreign keys, full table scans on multi-million row tables, and long-running transactions trigger exclusive table locks that bring all incoming traffic to a halt.
Connection Pool Exhaustion ("Too Many Clients")
Web workers and microservices spawning hundreds of direct database connections exhaust database backend memory, causing catastrophic error cascades.
Bloat, Vacuum Stalls & Degrading Disk I/O
Improper autovacuum tuning leads to massive dead tuple accumulation, inflating table sizes and causing random disk I/O bottlenecks.
Dangerous Unpartitioned Tables
Audit logs, analytics tables, and timeseries data crammed into a single monolithic table make backups, vacuuming, and indexes impossible to manage efficiently.
Our Database Engineering & Tuning Capabilities
Deep forensic analysis, index redesign, connection pooling, and read/write scaling.
Deep Query Forensics & Index Architecture
Detailed analysis of `pg_stat_statements` and query execution plans (`EXPLAIN ANALYZE`) to eliminate sequential scans with composite, partial, and GIN/GiST indexes.
Architectural Deliverables
- Top 20 slowest query remediation
- Partial and expression index optimization
- Elimination of redundant / unused indexes
- Sub-millisecond query execution plans
Connection Pooling with PgBouncer & Supavisor
Implementation of transaction-level connection pooling capable of handling 50,000+ client requests while maintaining a lean, fast pool of active worker backends.
Architectural Deliverables
- Transaction-mode PgBouncer architecture
- Connection starvation elimination
- Drastic memory overhead reduction
- Zero connection limit dropped packets
Table Partitioning & Cold Storage Archiving
Declarative range and hash partitioning on massive event and transaction tables to keep active working sets in RAM and automate cold data tiering.
Architectural Deliverables
- Range & list partitioning topologies
- Automated partition creation cron workers
- S3 cold-data archival pipelines
- Instant drop-partition data purges
Multi-Tiered Redis Caching & Read Replicas
Strategic caching layers and read-replica query routing that absorb up to 90% of read traffic before it ever touches your primary database.
Architectural Deliverables
- Cache-aside and write-through Redis models
- Automated cache invalidation protocols
- Read/write splitting database proxies
- Zero-lag streaming replication setup
Our 4-Step Database Optimization Protocol
Data-driven performance tuning backed by telemetry and zero-risk query rewrites.
Root Cause Bottleneck Identification
We inspect your query execution profiles, buffer cache hit ratios, lock wait queues, and transaction throughput to isolate exact bottlenecks.
- Database health & diagnostic report
- Query latency percentile breakdown
- Hardware resource utilization audit
Database Server Parameter Optimization
We tune critical PostgreSQL parameters (`shared_buffers`, `work_mem`, `maintenance_work_mem`, `effective_cache_size`, and autovacuum thresholds) for your hardware.
- Tuned configuration manifest
- Autovacuum concurrency schedule
- Memory allocation blueprint
Non-Blocking Index Application
We rewrite sluggish queries and create targeted indexes using non-blocking commands (`CREATE INDEX CONCURRENTLY`) to ensure zero table locking or production downtime.
- Optimized SQL query library
- Zero-downtime migration scripts
- Pre/post latency benchmarks
Elastic Scale & High Availability
We install and configure PgBouncer pooling layers, provision automated streaming read replicas, and establish automated failover.
- PgBouncer cluster deployment
- Read replica topology
- High-availability failover runbook
Production-Grade Technologies
We engineer zero-compromise platforms using battle-tested, high-concurrency open-source runtimes.
Primary Database
Connection Pooling
Caching & Acceleration
Monitoring & Forensics
Frequently Asked Questions
Honest answers to critical scoping, timeline, IP ownership, and technical questions.
01Can you optimize our production database without causing downtime?
02Why does our database crash when we add more application servers?
03How do you determine which queries need optimization?
04What is the difference between partitioning and sharding?
Complementary Solutions
Related Engineering Disciplines
Golang Backend Engineering
Connect your optimized PostgreSQL database to high-throughput, low-latency Go microservices.
Custom ERP & Business Operating Systems
Ensure your enterprise ERP processes high-volume accounting and inventory records with sub-millisecond speed.
Ready to engineer a platform that scales without breaking?
Talk directly with our principal systems architects. We analyze your technical requirements, diagnose bottlenecks, and deliver an actionable scoping roadmap.